
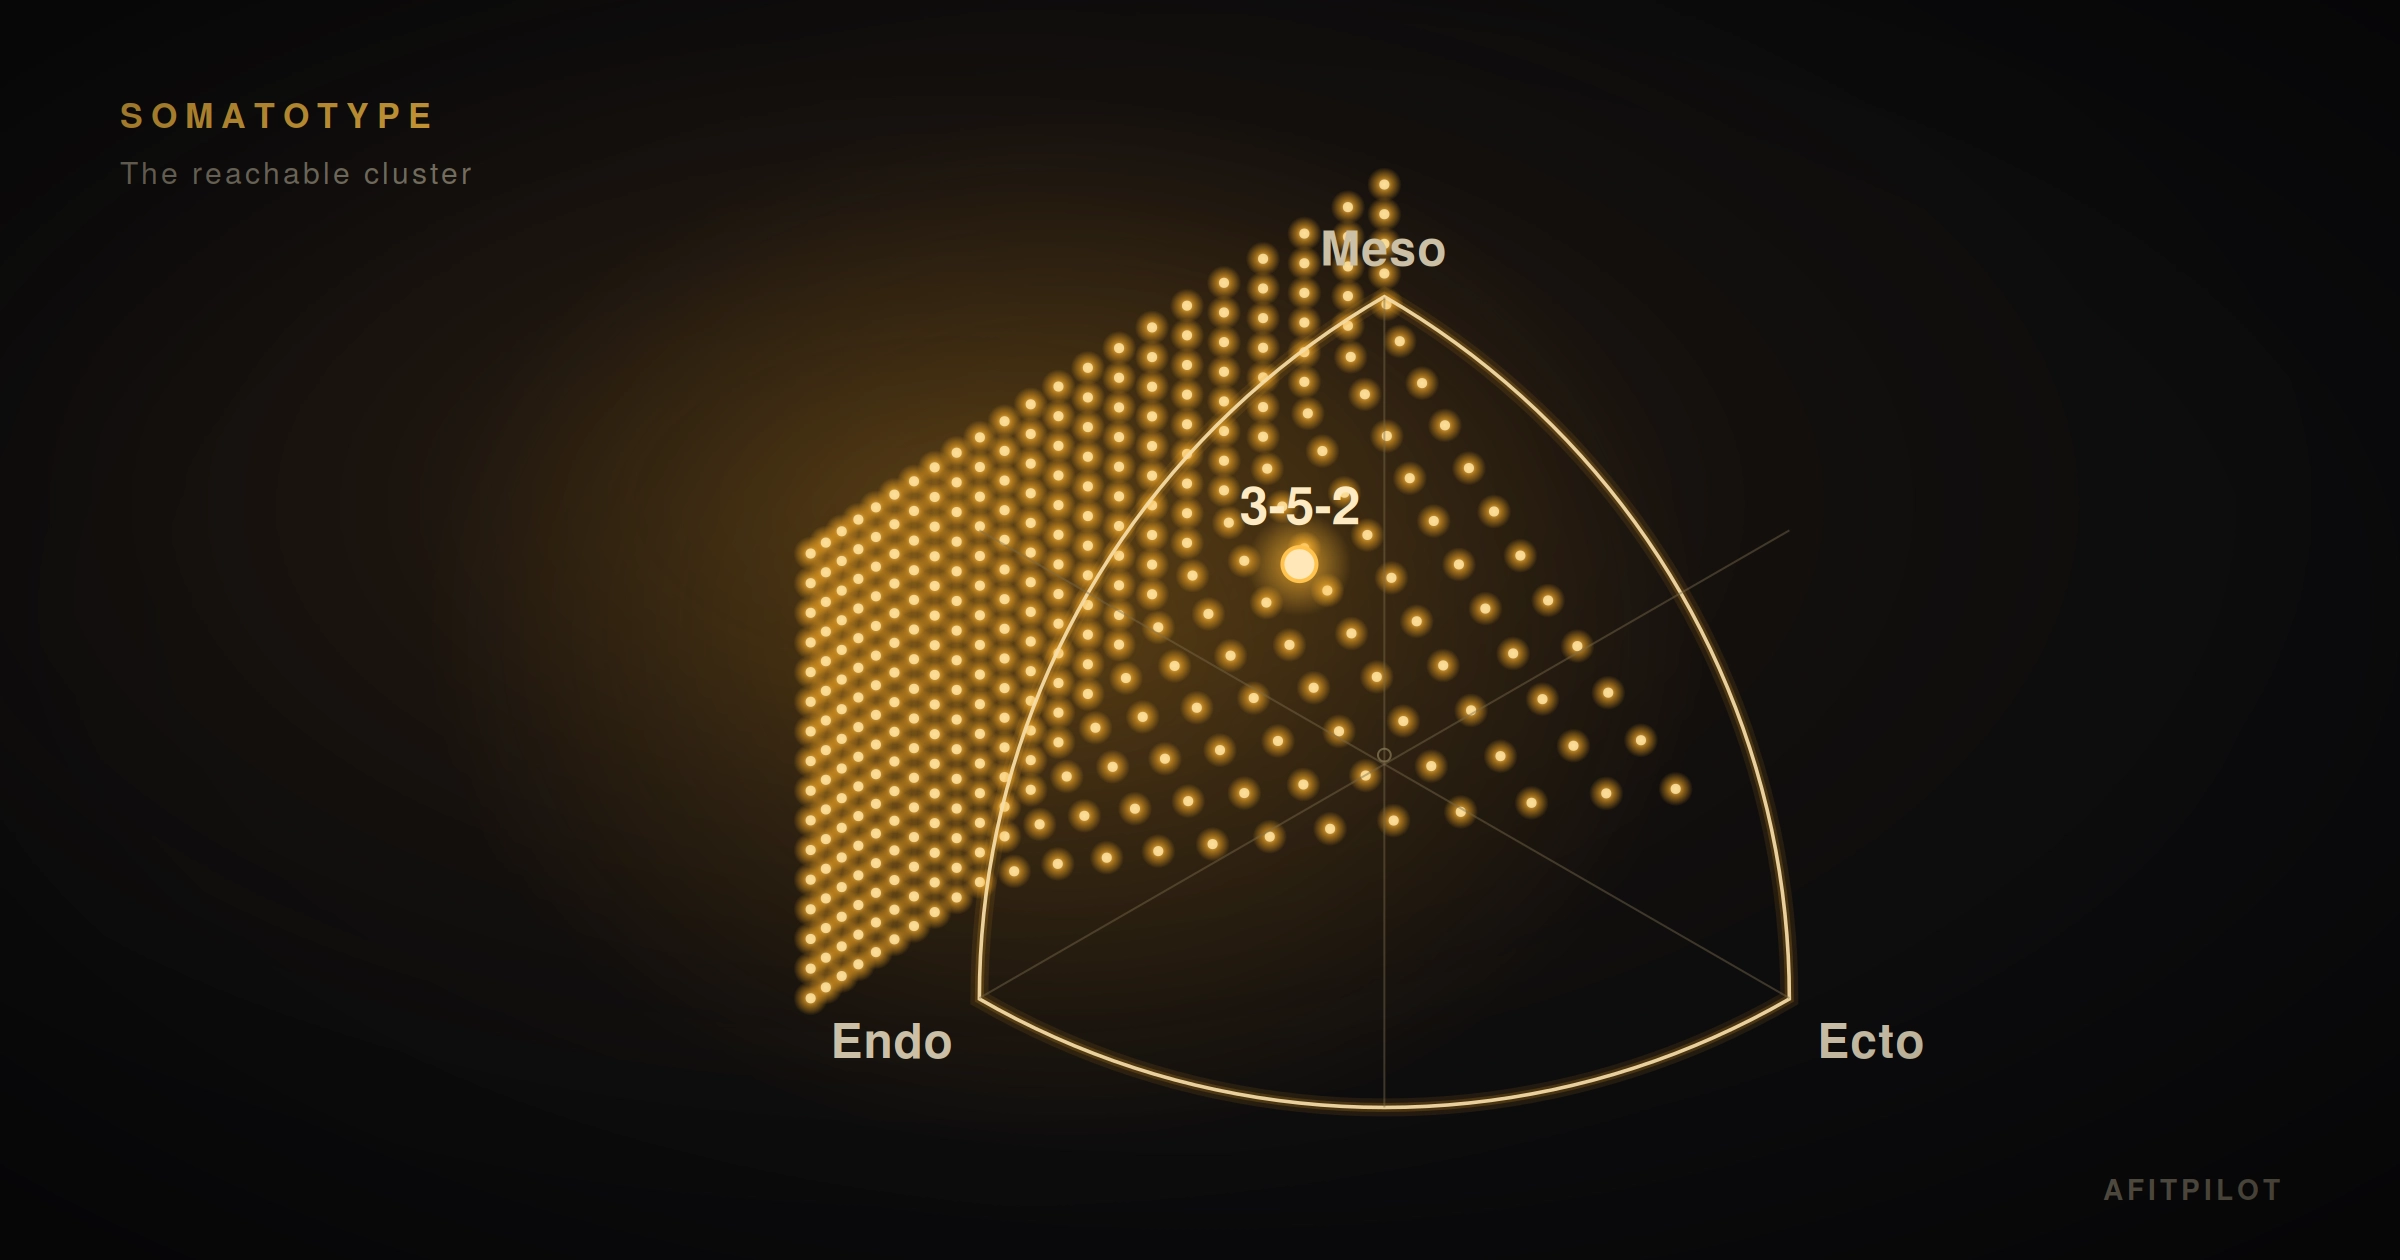
Somatotype usually gets discussed as a label — endomorph, mesomorph, ectomorph, or some three-number blend. Treated that way, it invites a question it can’t really answer: can you change your somatotype? The more useful framing is that the Heath-Carter equations describe a constrained system. Some of the inputs are fixed in adulthood and some are not, and once you know which is which, the question changes. It’s no longer “can it change” but “in which direction, by how much, and how fast.”
What the equations actually use
The anthropometric somatotype is computed from ten measurements feeding three components. Written out (Carter, 2002):
- Endomorphy = −0.7182 + 0.1451·X − 0.00068·X² + 0.0000014·X³, where X = (triceps + subscapular + supraspinale skinfolds) × (170.18 / height in cm).
- Mesomorphy = (0.858 × humerus breadth) + (0.601 × femur breadth) + (0.188 × corrected arm girth) + (0.161 × corrected calf girth) − (0.131 × height) + 4.5. Corrected girth is the limb girth minus the relevant skinfold, so it estimates the muscle-plus-bone underneath the fat.
- Ectomorphy is a linear function of the height-to-weight ratio (HWR = height / ∛weight). Below an HWR of 40.75 a second coefficient applies; below 38.25 the component floors at 0.1.
The point worth holding onto: each component is fed by a specific, identifiable set of inputs. Endomorphy is three skinfolds, height-corrected. Mesomorphy is two bone breadths, two muscle girths, and height. Ectomorphy is height and weight. Nothing else enters.
The fixed inputs
Two of these inputs do not move in an adult.
Height is fixed after the growth plates close, give or take a centimetre or two of diurnal and age-related variation. It appears in all three equations, which is why it does most of the work in pinning a person to one region of the chart. It scales the skinfold sum in endomorphy, it subtracts from mesomorphy, and it dominates the HWR that drives ectomorphy.
Bone breadths — the biepicondylar widths of the humerus and femur — are effectively immutable. Work on the genetic basis of skeletal proportions using UK Biobank imaging puts their heritability in roughly the 0.40–0.80 range, similar to standing height (Kun et al., Science, 2023). Training load doesn’t widen an epicondyle. In the somatotype overview literature, bone structure is treated as a fixed trait aside from minor changes with aging.
In the mesomorphy equation these two breadths carry coefficients of 0.858 and 0.601 — the largest in the formula. That sets a floor: a portion of someone’s mesomorphy is structural and won’t respond to anything you do in the gym or the kitchen.
So height plus the two breadths act as fixed coordinates. They locate a person within a region of the somatochart before any training or diet variable is considered. A short, broad-framed person cannot reach the extreme-ectomorph corner; a tall, narrow-framed person cannot reach the extreme-mesomorph corner. The fixed terms don’t permit it.
The malleable inputs and their ranges
The remaining inputs do move, but not equally, and not at the same speed.
| Input | Component | Realistic range of change | Notes |
|---|---|---|---|
| Sum of 3 skinfolds | Endomorphy | From ~12–15 mm (very lean) to 80–120+ mm; individual folds from ~3 mm to 40+ mm | The largest mover of any input |
| Body weight | Ectomorphy (via HWR) | Bounded by fat and lean change | Acts inversely: weight up lowers ectomorphy, weight down raises it |
| Corrected arm girth | Mesomorphy | Roughly +2–6 cm over years of hypertrophy training; far less once trained | Slow upward push |
| Corrected calf girth | Mesomorphy | Often under 2 cm | Largely genetically constrained |
Across a broad population the three components span most of a 1–8 scale — one study of mixed physiques recorded endomorphy 1.2–8.3, mesomorphy 0.7–8.7, and ectomorphy 0.1–7.1 (Ryan-Stewart et al., 2018). An individual does not get that whole span. They get a band whose width is set by how much fat and muscle they can add or shed, and whose position is set by the fixed inputs.
The asymmetry that matters
The three components do not migrate at the same rate, and the longitudinal evidence is fairly consistent on the ordering.
A study tracking elite basketball players across a season (Díaz-Martínez et al., Scientific Reports, 2024) found that a five-week intensive pre-season produced significant drops in body mass, skinfolds, and endomorphy, with a corresponding rise in ectomorphy — but no significant change in the mesomorphy variables. The authors note that muscle change is hard to elicit in already-trained athletes and tends to appear mainly in untrained people responding to a new stimulus. That gives a practical hierarchy:
- Endomorphy is the fast axis. Subcutaneous fat changes quickly and over a wide range, so endomorphy can shift two to four units within a single training and diet cycle. Under sustained energy deficit an endomorphic profile comes to resemble an ectomorphic one.
- Mesomorphy is the slow, floor-bounded axis. Only the muscle portion of the corrected girths moves it, slowly, and barely at all once someone is trained. A realistic figure is one to two units over a multi-year training career, less for experienced lifters.
- Ectomorphy is the dependent axis. With height fixed, it mostly tracks weight inversely, so it moves as a by-product of fat loss and muscle gain rather than as something you target directly.
In practice this means an individual’s reachable region is a diagonal band on the somatochart. Fat loss slides the somatopoint down in endomorphy and up in ectomorphy. Muscle gain nudges it up in mesomorphy and down in ectomorphy. The two trajectories are not symmetric: the fat axis is wide and fast, the muscle axis is narrow and slow.
Quantifying the movement
If you want to put a number on how far someone has moved, or could move, the relevant metric already exists. Somatotype attitudinal distance (SAD) measures the distance between two somatopoints in the three-dimensional somatic space, and somatotype attitudinal mean (SAM) averages it across a group. Carter and Heath’s monograph (Somatotyping: Development and Applications, Cambridge University Press, 1990) covers somatotype stability and change in detail and is the standard reference for this. For any goal-setting application, SAD between a person’s baseline and a proposed target is the natural unit, and it makes clear when a target sits outside the reachable band rather than inside it.
One measurement caveat is worth stating. Estimating somatotype from different input methods does not give interchangeable results. Concordance studies comparing anthropometry with bioelectrical impedance report meaningful disagreement, particularly for mesomorphy. If a somatopoint is built from mixed sources, the noise floor on any claimed migration is not negligible, and a change smaller than the measurement error isn’t a change.
Where the outliers sit, and what “off the chart” means
The thirteen standard somatotype categories are defined by the relationships among the three components — which one dominates, and how close the other two are — not by their absolute size. That sorts most of a population sensibly, but it has a blind spot at the extremes: a balanced 4-4-3 and a competitive strongman can fall under the same dominance label even though one sits comfortably inside the chart and the other is well outside it.
The somatochart makes the boundary concrete. Its triangle has vertices that correspond, roughly, to a dominant component near seven when the other two are low; push a component past that and the plotted point leaves the triangle. So there is a clear case for an “extreme” qualifier on top of the relationship category — endomorphic mesomorph names the relationship, extreme endomorphic mesomorph says the relationship holds and the magnitude is off the normal range.
Several populations live out there. Strongmen are the clearest. Eddie Hall competed near 190 kg at about 188 cm, and Hafþór Björnsson around 205 kg at 205 cm. Put those through the equations and ectomorphy floors at its minimum — both height-to-weight ratios sit far below the cutoff — while large frames, very high girths, and real carried fat push mesomorphy into the 9–12 range and endomorphy to 5–6. The result is an extreme endomorphic mesomorph that plots above the mesomorphy apex, outside the triangle. These are estimates from public competition measurements rather than laboratory ratings, but the direction is not in doubt: across weight-class athletes, the heaviest classes are consistently endomorphic mesomorphs, with ectomorphy falling and the other two components rising as the class gets heavier (Carter & Heath, 1990). Bodybuilders sit in the same corner but leaner — high mesomorphy with low endomorphy — and sumo wrestlers sit on the same side at the opposite pole, very high endomorphy alongside high mesomorphy.
Tall athletes go the other way, and the reason is in the equations. Height enters mesomorphy with a negative coefficient and dominates the height-to-weight ratio behind ectomorphy, so stature alone pushes a physique toward the ectomorphy corner and away from mesomorphy, regardless of how much muscle is present. Elite basketball shows it directly: in a 168-player World Championship sample, guards (mean height 1.72 m) rated about 2.9-3.9-2.6, while centres (1.90 m) rated about 3.2-3.1-3.4 — the taller players were less mesomorphic and more ectomorphic than their shorter teammates, despite carrying more absolute muscle (Carter, Ackland, Kerr & Stapff, 2005). A two-metre athlete with enormous limbs still scores lower mesomorphy than a much shorter lifter with the same girths, purely from the height term.
This is the fixed-anchor argument seen from the outside. Different people do not merely occupy different spots within one shared region; their fixed inputs place the region itself in different parts of the chart, and at the extremes those inputs push it clean off the standard triangle. The categories were built to describe a general population, so the honest way to handle the people beyond it is to mark them as beyond it rather than file them under the nearest ordinary label.
The practical upshot
A somatotype is not a destiny and it is not freely chosen either. It is a point inside a region whose boundaries are set by fixed skeletal inputs and whose interior is navigated, unevenly, by changing fat and muscle. The useful questions for anyone setting body-composition goals follow from that: which direction is open, how wide is the band in that direction, and is the target inside it. The fat axis usually has room. The muscle axis usually has less than people expect. Height and frame have none.
References
- Carter, J. E. L. (2002). The Heath-Carter Anthropometric Somatotype: Instruction Manual. Rosscraft.
- Carter, J. E. L., & Heath, B. H. (1990). Somatotyping: Development and Applications. Cambridge University Press.
- Carter, J. E. L., Ackland, T. R., Kerr, D. A., & Stapff, A. B. (2005). Somatotype and size of elite female basketball players. Journal of Sports Sciences, 23(10), 1057–1063.
- Díaz-Martínez, A. S., Vaquero-Cristóbal, R., Albaladejo-Saura, M., & Esparza-Ros, F. (2024). Effect of pre-season and in-season training on anthropometric variables, somatotype, body composition and body proportion in elite basketball players. Scientific Reports, 14, 7537.
- Kun, E., et al. (2023). The genetic architecture and evolution of the human skeletal form. Science.
- Ryan-Stewart, H., Faulkner, J., & Jobson, S. (2018). The influence of somatotype on anaerobic performance. PLOS ONE, 13(5), e0197761.
Leave a Reply
You must be logged in to post a comment.