Most training zone models are built around a single number. An athlete does a threshold test, or a coach estimates it from a recent race, and that one figure becomes the anchor for every zone in the plan. The problem is that lactate threshold is not a single point. It is two distinct physiological transitions, and collapsing them into one number is where most zone models go wrong before the plan even starts.
This article covers what LT1 and LT2 actually represent, why training between them is frequently misclassified, and what this means for how zones should be set and adjusted over a training block.
Two Thresholds, Not One
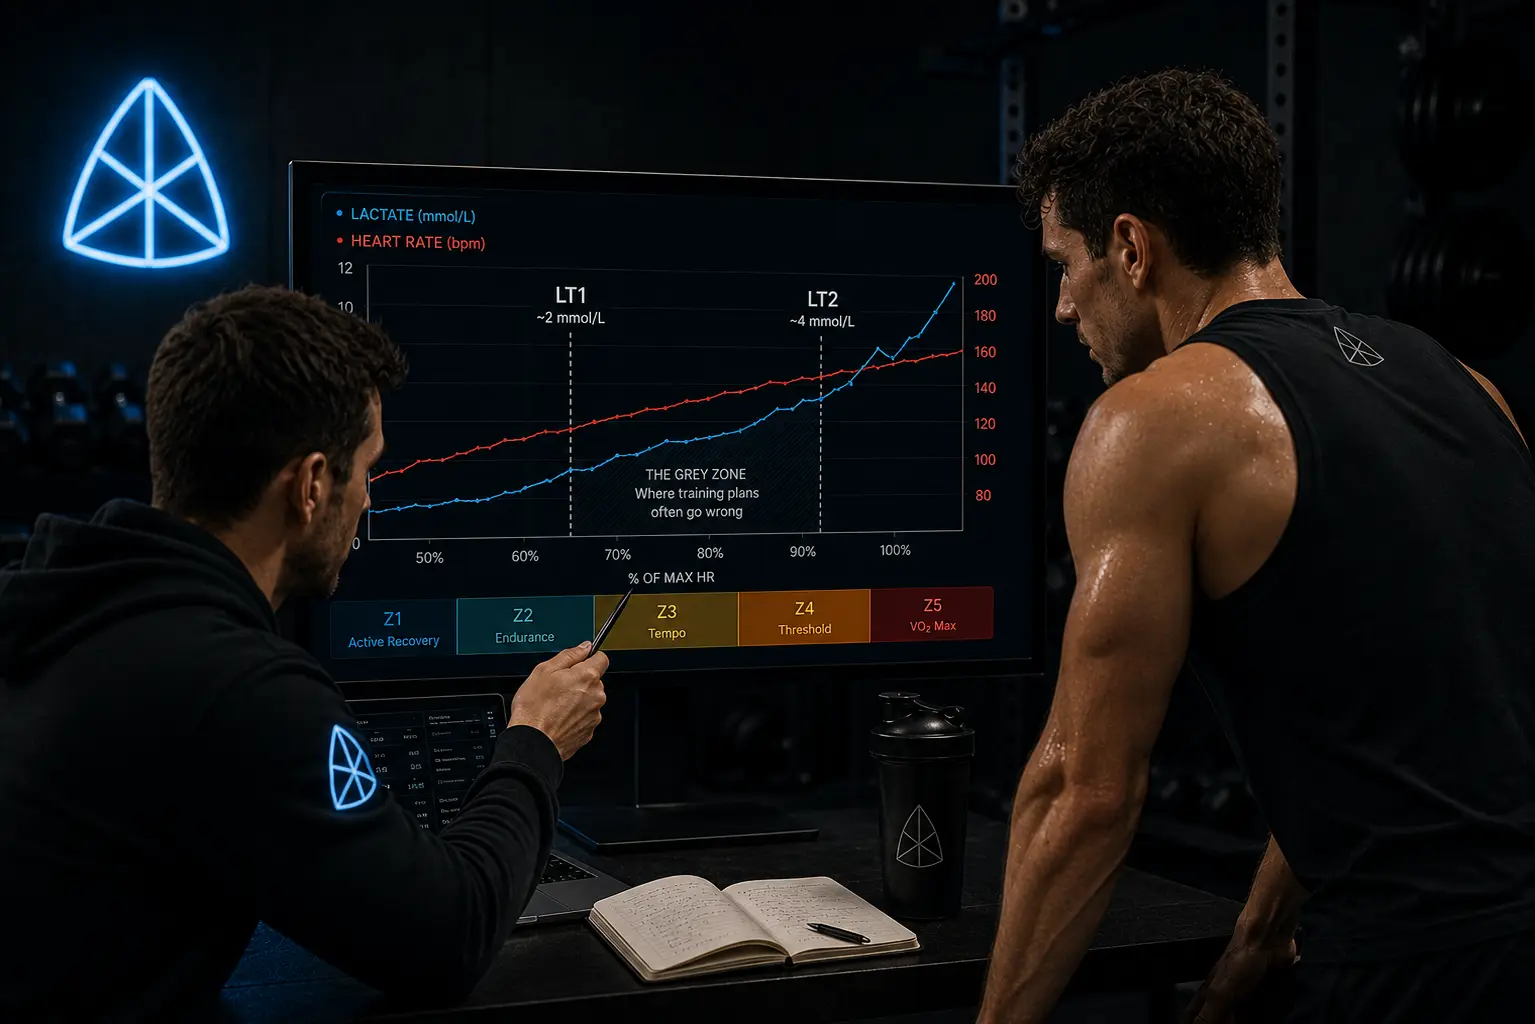
Blood lactate rises in a predictable but non-linear pattern as exercise intensity increases. At low intensity, lactate stays close to resting levels. As intensity rises, it reaches a point where it begins to climb above baseline. This is LT1, the aerobic threshold, generally associated with a blood lactate concentration around 2 mmol/L.
Intensity can continue to rise beyond LT1 without lactate accumulating uncontrollably, because the body can still clear lactate roughly as fast as it is produced. At a second, higher intensity, that balance breaks. Lactate production outpaces clearance, and concentration rises sharply rather than gradually. This is LT2, the anaerobic threshold, generally associated with a blood lactate concentration around 4 mmol/L and often referred to as maximal lactate steady state.
The zone between LT1 and LT2 is a genuine physiological zone, not a gap. It sits below the point of true lactate accumulation but above the easy aerobic range, and it is metabolically demanding in ways that are easy to underestimate when zones are built around a single threshold rather than both.
Where the Confusion Comes From
Different sources use different lactate concentrations, different rise criteria above baseline, and different terminology (lactate threshold, anaerobic threshold, ventilatory threshold, maximal lactate steady state, critical power) to describe what are often the same or closely related physiological points. LT1 is also harder to identify precisely than LT2. LT2 marks a clear before-and-after: lactate is stable below it and rises over time above it. LT1 is a more gradual departure from baseline, and where exactly to mark it depends on the criteria used.
This is part of why many training plans only reference one threshold. LT2 is easier to test, easier to define, and easier to build a single number around. The cost is that LT1, which marks the upper boundary of true easy aerobic training, often gets ignored or approximated poorly, and the zone between the two thresholds gets treated as a single block of “moderate” intensity rather than the specific, demanding zone it actually is.
Why This Causes Coaches to Misclassify Training
When zones are set from a single threshold, usually LT2, the model frequently divides intensity into broad bands that do not correspond to where the athlete’s physiology actually changes. The most common consequence is that genuinely easy aerobic training, which should sit below LT1, gets prescribed at an intensity that actually sits between LT1 and LT2.
This matters because the zone between the two thresholds is demanding in a way that easy aerobic work is not. Training here regularly, when the intent was recovery or aerobic base building, accumulates fatigue without delivering the specific adaptation either zone is meant to produce. It is too hard to be easy and too easy to be a genuine threshold session. This is a well-documented failure mode in endurance programming, and it is a direct consequence of building zones from one threshold instead of two.
A second consequence is in how threshold work itself is prescribed. Coaches who set threshold pace or power from a single estimated number, rather than testing LT2 specifically, risk assigning tempo and threshold sessions that are run too hard. Tempo runs assigned by feel rather than from a tested LT2 figure are a commonly cited example of training above the intended physiological target, which generates more fatigue than the session was designed to produce.
Individual Variation Makes Generic Zones Unreliable
LT1 and LT2 vary enormously between individuals, even at similar fitness levels. LT1 can fall anywhere from roughly 45% to 70% of maximum heart rate. LT2 can range from around 55% of maximum heart rate in untrained individuals to as high as 93% in elite athletes. A zone model based on a fixed percentage of age-predicted maximum heart rate, rather than an athlete’s actual tested thresholds, can place the same athlete in a different physiological zone than the model assumes.
This is the core argument for testing rather than estimating. A graded exercise test with blood lactate sampling is the most direct way to locate both thresholds. Field tests, such as a sustained time trial with average pace or power and heart rate recorded over the final portion of the effort, provide a practical estimate of LT2 where lab testing is not available. LT1 is harder to estimate in the field, and is frequently approximated as a percentage of LT2 rather than tested directly, which is itself a source of error worth being aware of rather than treating as precise.
Thresholds Move. Zones Should Move With Them.
LT1 and LT2 are not fixed points. As aerobic fitness improves, the pace or power an athlete can sustain at a given lactate concentration increases, meaning both thresholds shift upward over a training block even though the underlying lactate concentrations that define them stay the same. Tracking threshold pace or power over time is one of the more reliable indicators that training adaptation is occurring.
This creates a specific problem for zones set once at the start of a block and left unchanged. A zone model built from a threshold test in week one becomes progressively less accurate as the athlete adapts, particularly across a longer macrocycle. An athlete training in what was correctly identified as their threshold zone in week one may be training meaningfully below it by week eight, without anyone noticing, because the number defining the zone was never revisited.
This is also where perceived effort becomes a useful cross-check rather than a replacement for testing. An athlete whose reported effort for a session that was prescribed at a fixed pace or power has been quietly dropping over several weeks is showing exactly the kind of threshold shift that an unmoving zone model misses. Retesting periodically, or tracking the relationship between prescribed intensity and reported effort over time, is what keeps zones aligned with where the athlete actually is rather than where they were when the test was last run.
The Practical Takeaway
Zones built from a single threshold collapse two distinct physiological transitions into one number, and the zone between LT1 and LT2 is where this most commonly causes athletes to train harder than intended on days meant to be easy. Testing both thresholds, rather than estimating one and inferring the other, produces a more accurate picture of where an athlete’s zones actually sit. Because both thresholds shift with training, zones set once and never revisited drift out of alignment with the athlete’s actual physiology over the course of a block, and tracking the trend in perceived effort against prescribed intensity is a practical way to catch that drift between retests.
References
- Faude O, Kindermann W, Meyer T. Lactate threshold concepts: how valid are they? Sports Med. 2009;39(6):469-490. DOI: 10.2165/00007256-200939060-00003. PMID: 19453206
- Jamnick NA, Pettitt RW, Granata C, Pyne DB, Bishop DJ. An examination and critique of current methods to determine exercise intensity. Sports Med. 2020;50(10):1729-1756. DOI: 10.1007/s40279-020-01322-8. PMID: 32661839
- Benitez-Munoz JA, Guisado-Cuadrado I, Rojo-Tirado MA, Alcocer-Ayuga M, Romero-Parra N, Peinado AB, Cupeiro R. Changes in lactate concentration are accompanied by opposite changes in the pattern of fat oxidation: dose-response relationship. Eur J Sport Sci. 2024;24(11):1653-1663. DOI: 10.1002/ejsc.12211. PMID: 39477549. PMC: PMC11534652
- Seiler S. What is best practice for training intensity and duration distribution in endurance athletes? Int J Sports Physiol Perform. 2010;5(3):276-291. DOI: 10.1123/ijspp.5.3.276. PMID: 20861519
- Rodrigues F, et al. Internal training load perceived by athletes and planned by coaches: a systematic review and meta-analysis. Sports Med Open. 2022;8(1):37. DOI: 10.1186/s40798-022-00420-3. PMC: PMC8897524
Leave a Reply
You must be logged in to post a comment.